Let’s be honest — we live in a world drowning in data. Every click, sale, message, and interaction leaves a digital footprint. Businesses today generate mountains of information daily, yet many still struggle to make sense of it. That’s where performance analytics steps in like a compass in a storm.
Think about this: companies that rely on data-driven decisions are proven to be more productive and more profitable than those that rely on gut feelings. And yet, many organizations still make decisions based on instinct rather than insight.
The bridges that gap. It turns raw numbers into clarity. It connects effort to outcomes. And most importantly, it helps businesses understand what’s actually working and what isn’t.
In this beginner-friendly guide, we’ll break down performance analytics in simple language. No jargon. No fluff. Just clear explanations, real-world relevance, and practical understanding — all written like a human talking to another human.
What Is Performance Analytics? (In Plain English)
the practice of using data to measure how well something is performing over time. That “something” could be a business, a team, a process, or even an entire organization.
Instead of guessing why sales dropped or why productivity improved, performance analytics gives you evidence. It shows patterns. It highlights trends. And it reveals relationships that are invisible to the naked eye.
Think of it like a fitness tracker for your business. Just as a smartwatch tracks steps, heart rate, and sleep, performance analytics tracks productivity, efficiency, growth, and result.
It answers questions like:
-
Are we meeting our goals?
-
What’s slowing us down?
-
Where should we focus our energy?
-
What’s actually working?
And the beauty? It’s not limited to one department. Marketing, HR, finance, operations — everyone can use it.
Why Performance Analytics Is So Important Today
Let’s face it — the business world moves fast. Customer preferences change overnight. Markets shift. Technology evolves. If you’re not tracking performance in real time, you’re already behind.
Here’s why performance analytics has become non-negotiable:
1. It Replaces Guesswork with Clarity
No more relying on opinions or assumptions. Data shows what’s real.
2. It Speeds Up Decision-Making
When insights are clear, decisions come faster — and with more confidence.
3. It Improves Focus
Instead of tracking everything, teams focus on what actually moves the needle.
4. It Builds Accountability
When performance is visible, ownership naturally follows.
5. It Supports Long-Term Growth
You don’t just fix problems — you prevent them.
In short, performance analytics turns chaos into clarity.
Core Objectives of Performance Analytics
Performance analytics isn’t about collecting data for the sake of it. It has clear goals that guide its use.
1. Visibility
Organizations want to know where they stand. Performance analytics provides a clear snapshot of current performance across teams and systems.
2. Alignment
When everyone understands how their work contributes to larger goals, alignment happens naturally.
3. Continuous Improvement
Analytics highlights strengths and exposes gaps, making improvement a continuous process.
4. Risk Reduction
Early warnings prevent small problems from becoming expensive disasters.
5. Strategic Decision Support
Leadership decisions become grounded in facts rather than assumptions.
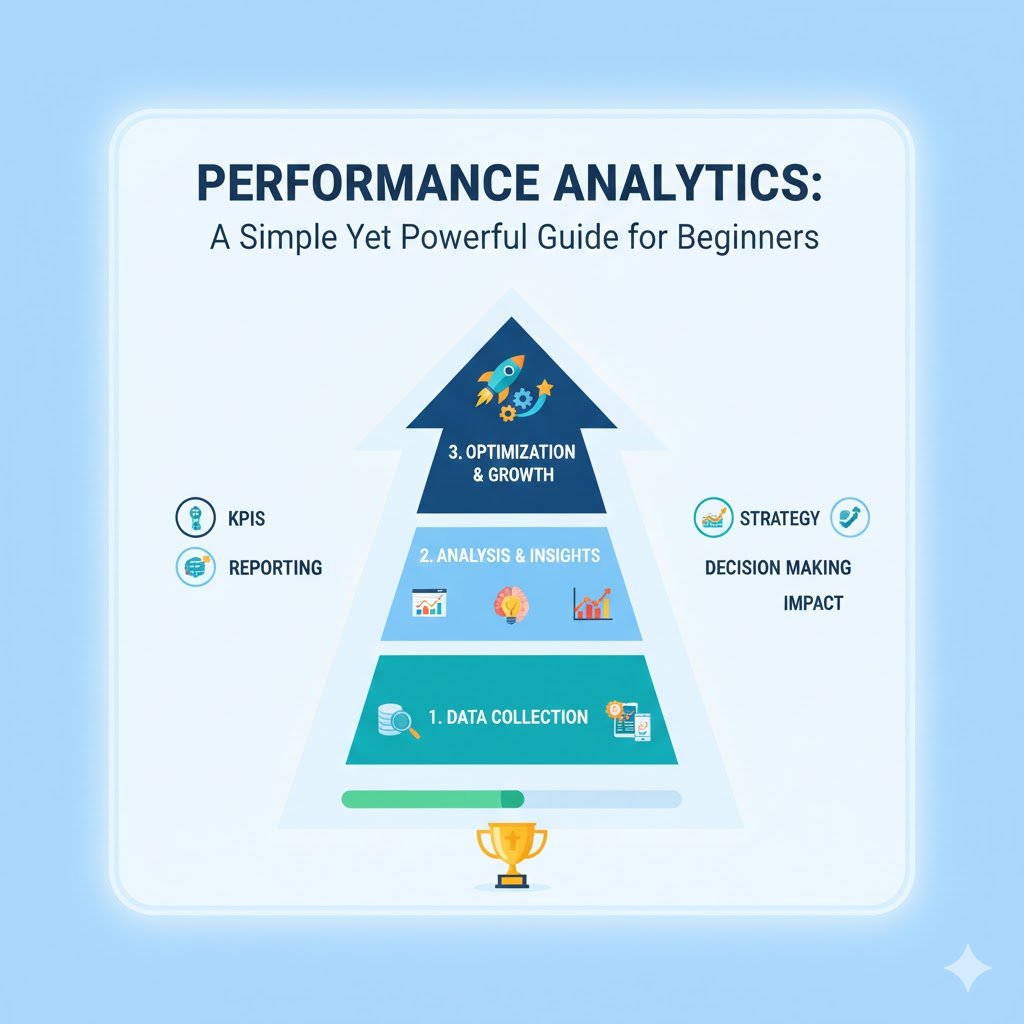
How Performance Analytics Actually Works
At its core, follows a simple cycle:
Step 1: Data Collection
Data comes from many sources — sales tools, customer systems, financial records, employee platforms, and more.
Step 2: Data Processing
Raw data is cleaned, organized, and structured so it can be analyzed accurately.
Step 3: Analysis & Visualization
Dashboards, charts, and reports reveal patterns, trends, and performance gaps.
Step 4: Interpretation
Teams interpret the insights to understand what’s driving results.
Step 5: Action
Decisions are made, strategies adjusted, and improvements implemented.
Step 6: Continuous Monitoring
The cycle repeats, allowing organizations to stay agile and responsive.
Think of it as a feedback loop that never sleeps.
Types of Performance Analytics Explained Simply
Different questions require different types of analytics. Let’s break them down.
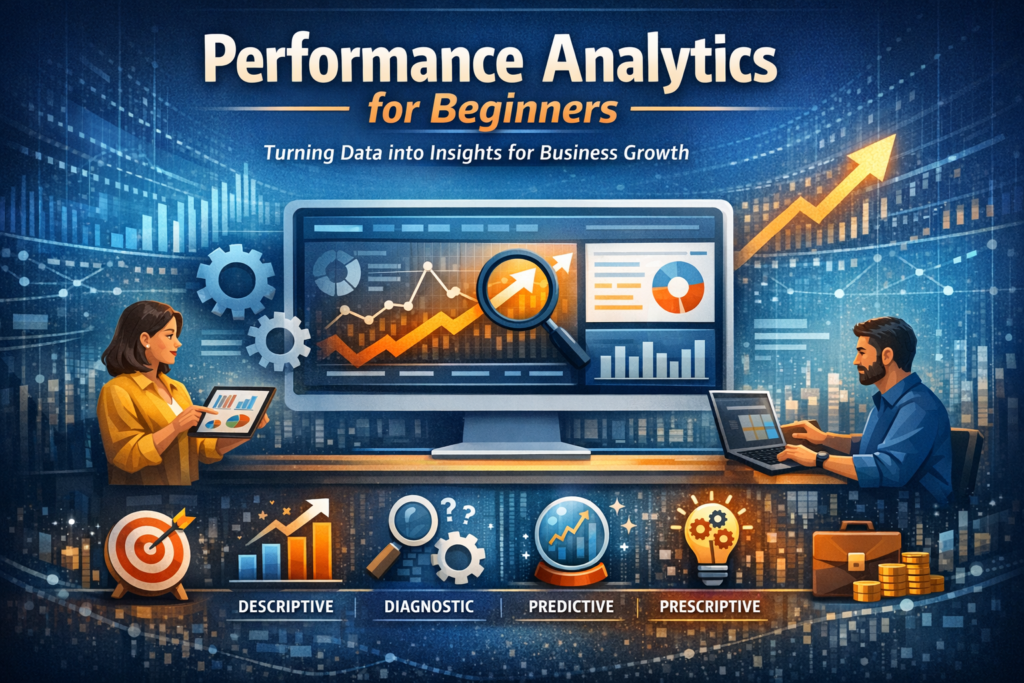
1. Descriptive Analytics – What Happened?
This is the foundation. It summarizes historical data to show past performance. Dashboards, reports, and summaries fall into this category.
Example: “Sales increased by 12% last quarter.”
2. Diagnostic Analytics – Why Did It Happen?
Here’s where you dig deeper. This type identifies causes behind outcomes.
Example: “Sales increased because of a new marketing campaign.”
3. Predictive Analytics – What’s Likely to Happen Next?
Using historical trends and patterns, predictive analytics forecasts future outcomes.
Example: “If current trends continue, sales will grow 8% next quarter.”
4. Prescriptive Analytics – What Should We Do?
This goes one step further and recommends actions.
Example: “Increase ad spend in high-performing regions.”
5. Advanced Analytics – Deep Intelligence
This includes machine learning and complex modeling for large datasets.
6. Real-Time Analytics – What’s Happening Now?
Live data helps organizations react instantly, especially in fast-moving environments.
Key Performance Indicators (KPIs): The Heart of Analytics
Key Performance Indicators (KPIs) are measurable values that show how well something is performing.
They help organizations:
-
Track progress
-
Identify weaknesses
-
Align teams
-
Measure success objectively
Common KPIs Include:
-
Revenue
-
Profit margin
-
Customer satisfaction
-
Employee engagement
-
Productivity
-
Retention rates
Good KPIs are clear, measurable, and aligned with business goals.
Benefits
1. Clear Visibility Across Operations
Leaders see what’s working and what’s not — instantly.
2. Smarter Decision-Making
Data replaces gut feelings.
3. Better Efficiency
Waste and bottlenecks become visible.
4. Stronger Accountability
Everyone knows what success looks like.
5. Continuous Improvement
Learning becomes ongoing, not occasional.
6. Strategic Alignment
All departments move in the same direction.
7. Faster Response to Change
Markets change — analytics helps you keep up.
Common Challenges in Performance Analytics
Even powerful tools have obstacles:
-
Poor data quality
-
Disconnected systems
-
Lack of analytical skills
-
Resistance to change
-
Overcomplicated dashboards
The solution? Strong leadership, clean data, training, and a culture that values insight over instinct.
Performance Analytics vs Performance Appraisals
| Aspect | Performance Analytics | Performance Appraisals |
|---|---|---|
| Focus | Systems & outcomes | Individual employees |
| Frequency | Continuous | Periodic |
| Data | Objective & data-driven | Subjective |
| Purpose | Improve operations | Evaluate people |
| Outcome | Strategic insight | Feedback & ratings |
Traditional Reviews vs Performance Analytics
| Area | Traditional Review | Performance Analytics |
|---|---|---|
| Timing | Annual | Continuous |
| Accuracy | Subjective | Data-based |
| Focus | Past | Present & future |
| Actionability | Limited | High |
How to Implement Performance Analytics Successfully
Step 1: Define Clear Goals
Know what you want to improve.
Step 2: Choose the Right KPIs
Metrics should reflect meaningful outcomes.
Step 3: Gather Reliable Data
Ensure accuracy and consistency.
Step 4: Use Dashboards
Visuals make insights easy to understand.
Step 5: Compare & Benchmark
Track progress over time.
Step 6: Identify Root Causes
Use data to uncover real problems.
Step 7: Take Action
Turn insights into improvements.
Step 8: Maintain Feedback Loops
Keep refining and improving.
Popular Tools Used in Performance Analytics
ServiceNow Performance Analytics
Tracks workflows and operational efficiency in real time.
SAP SuccessFactors
Focuses on workforce performance and talent management.
Salesforce
Analyzes sales data, customer behavior, and revenue trends.
NetApp
Optimizes data infrastructure and system performance.
Microsoft Dynamics 365 Finance
Delivers deep financial insights for smarter decisions.
Real-World Use Cases of Performance Analytics
Sales
Tracks conversions, pipeline health, and revenue trends.
Supply Chain
Improves inventory management and delivery timelines.
Marketing
Optimizes campaigns and user engagement.
Operations
Improves efficiency and reduces waste.
Why Performance Analytics Is a Long-Term Advantage
Performance analytics isn’t just a tool — it’s a mindset. When organizations commit to data-driven thinking, they gain clarity, confidence, and consistency.
It aligns teams. It sharpens strategies. And it creates a culture of continuous improvement.
Final Thoughts
Performance analytics transforms information into intelligence. It removes guesswork and replaces it with clarity. When used consistently, it becomes a powerful engine for growth.
Businesses that invest in performance analytics don’t just survive — they evolve.
And in today’s competitive world, that makes all the difference.
Performance analytics is no longer optional. It’s essential. It empowers organizations to see clearly, act confidently, and grow sustainably. By turning data into direction, businesses unlock smarter decisions and stronger performance across every level.
Start small. Stay consistent. Let data guide the way.