
In the competitive world of digital marketing, understanding how users interact with your website is crucial for success. One of the most powerful tools for gaining these insights is heatmaps. Heatmaps visually represent user behavior on your website, showing where users click, scroll, and spend the most time. By analyzing this data, you can identify areas for improvement and optimize your website for a better user experience (UX).
In this article, we’ll explore what heatmaps are, why they matter, and how you can use them to enhance your website’s UX. Whether you’re a business owner, marketer, or web designer, these insights will help you create a website that engages users and drives results.
What Are Heatmaps?
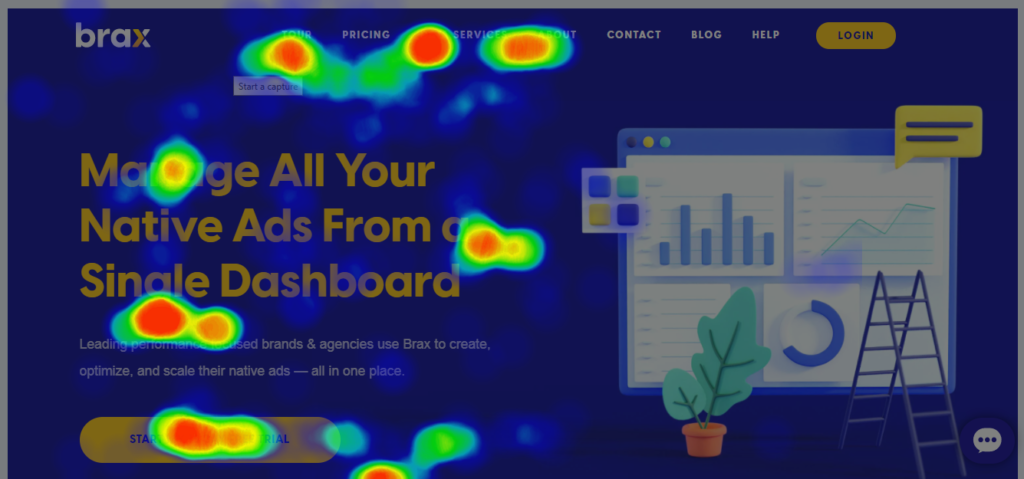
Heatmaps are visual representations of data that use color gradients to show user activity on a webpage. The most common types of heatmaps include:
- Click Heatmaps: Show where users click on your website, including links, buttons, and non-clickable elements.
- Scroll Heatmaps: Reveal how far users scroll down a page, helping you understand which sections get the most attention.
- Move Heatmaps: Track where users move their mouse, which often correlates with where they’re looking.
- Attention Heatmaps: Combine click, scroll, and move data to show which areas of a page attract the most attention.
By analyzing these heatmaps, you can gain valuable insights into how users interact with your website and identify opportunities for improvement.
Why Heatmaps Matter for User Experience
Heatmaps provide actionable data that can help you optimize your website for better UX. Here’s why they matter:
1. Identify User Behavior Patterns
Heatmaps reveal how users navigate your website, what they click on, and where they lose interest. This helps you understand their behavior and preferences.
2. Improve Website Layout
By analyzing heatmaps, you can identify which elements of your website are most engaging and which are being ignored. This allows you to optimize your layout for better usability.
3. Increase Conversions
Heatmaps can help you identify obstacles that prevent users from taking desired actions, such as filling out a form or making a purchase. By addressing these issues, you can improve conversion rates.
4. Reduce Bounce Rates
If users are leaving your website quickly, heatmaps can help you identify why. For example, if users aren’t scrolling past the fold, you may need to make your content more engaging.
5. Make Data-Driven Decisions
Heatmaps provide concrete data to support your design and content decisions, reducing guesswork and ensuring your changes are effective.
How to Use Heatmaps to Improve Your Website’s UX
Now that you understand the importance of heatmaps, let’s explore how you can use them to enhance your website’s user experience.
1. Analyze Click Heatmaps to Optimize CTAs
Click heatmaps show where users are clicking on your website, including buttons, links, and even non-clickable elements. This data can help you optimize your calls-to-action (CTAs) and improve conversions.
How to Use Click Heatmaps:
- Identify which CTAs are getting the most clicks and which are being ignored.
- Move underperforming CTAs to more prominent locations.
- Test different colors, text, and placements to see what works best.
2. Use Scroll Heatmaps to Improve Content Placement
Scroll heatmaps reveal how far users scroll down a page and where they lose interest. This helps you determine if your most important content is being seen.
How to Use Scroll Heatmaps:
- Ensure key information is placed above the fold (the portion of the page visible without scrolling).
- Shorten pages with high drop-off rates or make content more engaging.
- Use anchor links to help users navigate long pages.
3. Leverage Move Heatmaps to Understand User Attention
Move heatmaps track where users move their mouse, which often correlates with where they’re looking. This data can help you understand which areas of your website attract the most attention.
How to Use Move Heatmaps:
- Place important content or CTAs in areas that attract the most attention.
- Identify distractions, such as unnecessary images or text, and remove them.
- Test different layouts to see which ones guide users’ attention effectively.
4. Combine Heatmaps with Other Analytics Tools
While heatmaps provide valuable insights, they’re even more powerful when combined with other analytics tools, such as Google Analytics or session recordings.
How to Combine Data:
- Use heatmaps to identify problem areas, then dive deeper with session recordings to understand user behavior.
- Compare heatmap data with bounce rates and conversion rates to identify trends.
- Use A/B testing to validate changes based on heatmap insights.
5. Optimize for Mobile Users
With over 60% of global web traffic coming from mobile devices, it’s essential to analyze heatmaps specifically for mobile users. Mobile heatmaps can reveal unique challenges, such as difficult-to-click buttons or slow-loading content.
How to Optimize for Mobile:
- Ensure CTAs and links are large enough to be easily tapped.
- Simplify navigation for smaller screens.
- Test your website’s mobile performance using tools like Google’s Mobile-Friendly Test.
6. Identify and Fix Usability Issues
Heatmaps can help you identify usability issues that frustrate users and drive them away. For example, if users are clicking on non-clickable elements, it may indicate confusion or poor design.
How to Fix Usability Issues:
- Make non-clickable elements less prominent or add functionality.
- Simplify navigation to reduce confusion.
- Use clear labels and instructions to guide users.
7. Test and Iterate
Heatmaps provide a snapshot of user behavior, but user preferences and behaviors can change over time. Regularly test and iterate based on heatmap data to ensure your website remains effective.
How to Test and Iterate:
- Conduct A/B tests to compare different designs or layouts.
- Monitor heatmaps after making changes to measure their impact.
- Continuously gather feedback from users to identify new areas for improvement.
Tools for Creating and Analyzing Heatmaps
There are several tools available for creating and analyzing heatmaps. Here are a few popular options:
1. Hotjar
Hotjar is a comprehensive tool that offers heatmaps’s, session recordings, and surveys. It’s user-friendly and provides detailed insights into user behavior.
2. Crazy Egg
Crazy Egg specializes in heatmaps and A/B testing. It’s a great option for businesses looking to optimize their website for conversions.
3. Mouseflow
Mouseflow offers heatmaps’s, session recordings, and funnel analysis. It’s ideal for businesses that want to dive deep into user behavior.
4. Google Analytics
While not a heatmap tool itself, Google Analytics can be integrated with heatmap tools to provide a more comprehensive view of user behavior.
Conclusion
Heatmaps are a powerful tool for understanding how users interact with your website and identifying opportunities for improvement. By analyzing click, scroll, and move heatmaps, you can optimize your website’s layout, improve usability, and increase conversions.
Start using heatmaps today to gain valuable insights into your website’s performance and create a user experience that keeps visitors engaged and coming back for more. Remember, the key to a successful website is continuous improvement—heatmaps’s provide the data you need to make informed, effective changes.
Read Moree: The Importance of Website Security and How to Protect Your Site
High-Authority Links Included:
- Google Analytics – A tool for tracking website performance and user behavior.
- Google’s Mobile-Friendly Test – A tool for testing mobile responsiveness.